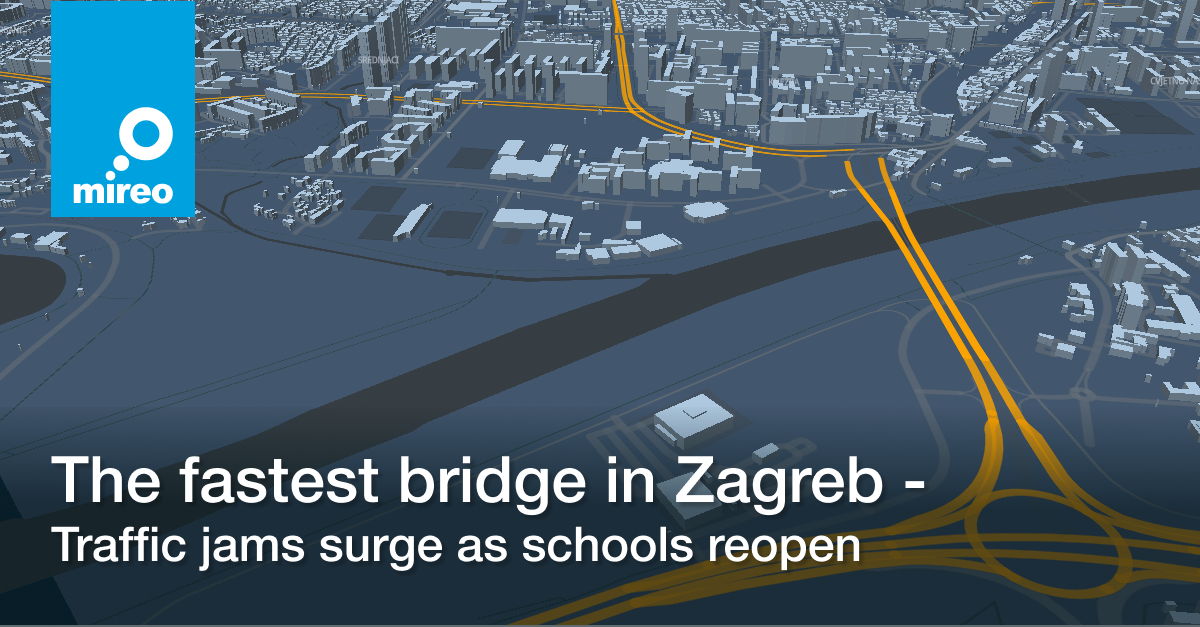
The fastest bridge in Zagreb

Dijana Matošević - 29/04/2021 | 4 min read
Telematics Big Data Traffic analysis Urban mobility

How would you describe the traffic in your city?

You'd probably answer along these lines: "Well, obviously there are morning and afternoon rush hours when I drive so slow I want to pull my hair out. It's slightly better in between, but in the evenings, I can finally drive at normal speeds.

But, how well do you know when it's absolutely the worst time to drive on certain roads, when to avoid them, and which detour route to take?

Here, we present a brief analysis of traffic patterns across 3 central bridges in Zagreb, so you can check how accurate your assumptions are. We'll discover the exact timings when the traffic jams occur on each bridge, which bridge is the fastest one, and some caveats, such as how did remote work changed the list.

Just for fun, make sure to write down your assumptions.

To keep the analysis objective, we analyzed historical GPS driving data from vehicles of mixed types from the proprietary GPS tracking solution, matched them precisely to the road network, reconstructed their speeds, and measured the speed fluctuation in 15 minutes timespans during the workdays. It can't go any more accurate than this, right?

Just to preface, the city of Zagreb is built around the Sava river, which splits the city into the Northern and Southern parts. Southern Zagreb is a predominantly residential area, while the northern is a business/administrative area. Therefore, due to everyday commuting, the traffic towards the North is generally much heavier in the mornings and vice versa in the afternoon hours.

Which one of the central bridges is the slowest?

Jadranski, Sloboda, and Mladost (Adriatic, Freedom, and Youth) bridges are considered the central bridges, while the other four are mainly used to bypass the traffic jams in the broader city center.

Direction North

The battle for the slowest one is tight between Jadranski bridge and Sloboda bridge, but the Jadranski bridge would have to take the prize due to almost 2-hour long afternoon traffic jams between 15:15 and 17:15.

Average speed across Zagreb bridges, Spring 2021, direction North

Average speed across Zagreb bridges, Spring 2021, direction North

Plot twist #1

The morning jams begin at 7:15 and stop at 8:00. But the afternoon jams last significantly longer - they occur between 15:15 and 17:00!

At its worst, the traffic in afternoon hours is 35% slower on Sloboda bridge and 50% slower on Jadranski bridge.

The morning traffic jams are easily explained with morning commuting, but the afternoon jams are somewhat harder to explain. For example, running errands after work or leaving work earlier prompt as the most straightforward reasons.

Plot twist #2

Totally unexpected, but not only that there are absolutely no traffic jams on the Mladost bridge, but with a stunning 65 km/h average travel speed, it's by far the fastest central bridge.

But it wasn't always like this. Before the pandemic, the Mladost bridge was also infamous for the entire-length-long morning jams towards the North. However, the afternoon jam towards the North never existed.

Naturally, the traffic jams disappeared during the pandemics and remained non-existent until the July 2020, when the reconstruction of the southern access viaduct to the Mladost bridge started. And, entirely unexpected, the traffic jams disappeared in September 2020. Did the people simply started to avoid this bridge or started working remotely again, it is still unclear.

Plot twist #3

However, don't be fooled by the fast traffic across the Mladost bridge. Continuing journey to the North, the traffic jams at the Držićeva-Vukovarska intersection annul a certain amount of time saved. The traffic signal cycle on this intersection is one of the longest ones in Zagreb.

Average speed profile Zagreb Mladost bridge - Vukovarska intersection, 2021, direction North

Average speed profile Zagreb Mladost bridge - Vukovarska intersection, 2021, direction North
Direction South

Traffic across the Sloboda bridge (due to its central position, often dubbed as The middle one) is by far the slowest one in the afternoons.

Average speed across Zagreb bridges, Spring 2021, direction North

Average speed across Zagreb bridges, 2021, direction South

In general, there are no prominent morning traffic jams towards the South on any* of the bridges, which is aligned with morning commuting to work. Traffic is only slightly slower between 07:30 and 08:00, or 08:00 - 08:15 on the Sloboda bridge.

However, the afternoon traffic jams are very much noticeable, again starting from 15:00 and lasting until 17:00.

Plot twist #4

There are no traffic jams on the Jadranski bridge towards the South because they occur at the bridge's entrance in Horvaćanska street. Observing the Horvaćanska street segment, it's easy to spot the morning and afternoon jams in their full glory.

On the Mladost bridge, despite the one lane being permanently closed for reconstruction, the effect on the traffic slowdown is minimal.

How did the pandemic and working remote affect the traffic?

Without a doubt, the traffic is faster and the morning traffic is significantly lighter. During the morning rush hours, the traffic is up to 10 km/h faster, comparing to less than 5 km/h speed increase in afternoon hours.

Apparently, the essential businesses and deliveries are still very much active, and despite the remote working, people are continuing to run their everyday errands, shifting the commuting patterns to afternoon hours.

To the interested reader

If this topic intrigued you and you want to discover further connected car data applications in smart city solutions, make sure to explore the SpaceTime Interactive Demo.

The interactive demo portrays how innovative and agile city governments can utilize connected car data in revealing and improving traffic intensity, traffic patterns, speeding hotspots, and many others.

SpaceTime Interactive Demo

How we did it?

This analytics is made using Mireo SpaceTime Roadway Analytics.We took historical GPS driving data from vehicles of mixed types from the proprietary GPS tracking solution, matched them precisely to the road network, and precisely reconstructed their speeds.

This is the actual SQL query which we have executed against SpaceTime to generate the average speed data. SpaceTime executed the query against 15 billion-record table in just few seconds (note the spatial operations in the query which are typically considered “Achilles heel” of relational databases).


		select
		TO_CHAR(ds::timeperiod, '%H:%M') as hour, 3.6 * av as speed
		from (
		select
			((t[0]::int64 - TS_TRUNC('day', t[0], 'Europe/Zagreb')::int64) / 900 ) * 900 as ds,     
			sum(SPHERE_LENGTH(x[0], y[0], x[1], y[1])) / sum((t[1]- t[0])::int64) as av
		from st.segments
		where
			ST_Intersects(
			ST_GeomFromText('POLYGON (({poly}))'),
			ST_Line(x[0], y[0], x[1], y[1])
			)
		and t[0] >= ts('{tstart}', 'Europe/Zagreb') and t[1] <= ts('{tend}', 'Europe/Zagreb')
		and TS_EXTRACT('dow', t[0]) between 1 and 5
		and TS_EXTRACT('hours', t[0], 'Europe/Zagreb') between 5 and 20
		group by 1
		)
		

If you liked this, here’s what to read next: